Edited & Reviewed by: Taranjit Singh
Have you ever wondered what the secret language of the markets might reveal about future financial trends? Candlestick chart patterns, with their origins steeped in the ancient trade routes of Japan, serve as a modern-day financial Rosetta Stone. Did you know that over 75% of traders incorporate these patterns into their analysis? This guide will illuminate the path to understanding these intricate designs, offering a clear and concise exploration of each pattern’s significance. Whether you’re a seasoned investor or taking your first steps into the world of trading, mastering candlestick chart patterns can be your key to unlocking market insights.
Introduction to Candlestick Chart Patterns
The Major Candlestick Patterns
Advanced Candlestick Patterns
Candlestick Patterns in Different Time Frames
Technical Analysis with Candlestick Patterns
Case Studies: Candlestick Patterns in Action
Key Takeaways
Bottom Lines
Introduction to Candlestick Chart Patterns
The legacy of candlestick chart patterns is deeply rooted in the annals of 18th-century Japan, where savvy rice merchants first employed these visual storytellers to chronicle the ebb and flow of market prices. Among these pioneering traders, Munehisa Homma stands tall, often hailed as the architect of this revolutionary technique. Fast forward to the twilight of the 20th century, and these patterns made a grand entrance into the Western financial lexicon, propelled by Steve Nison’s seminal work, “Japanese Candlestick Charting Techniques.”
The aesthetic appeal of candlestick patterns is surpassed only by their ability to capture the market's psychological pulse. They paint a vivid picture of the ongoing duel between bullish optimism and bearish caution, distilling the collective mood and market narratives into a single frame. This visual intelligence serves as a beacon for traders and analysts, illuminating the path to informed decision-making and offering a glimpse into the market’s potential future course. 🌟
The Major Candlestick Patterns
Candlestick patterns are the language of the markets, a dialect spoken through the shapes and shades of each candle. They are not mere patterns, but narratives of market sentiment, each telling a tale of supply and demand.
Reversal Patterns:
Hammer
Hanging Man
Morning Star and Evening Star: These trios of candles serve as celestial guides, heralding reversals. The Morning Star, a bullish harbinger, rises from the dusk of a downtrend, while the Evening Star, a bearish signal, fades in the twilight of an uptrend.
Continuation Patterns:
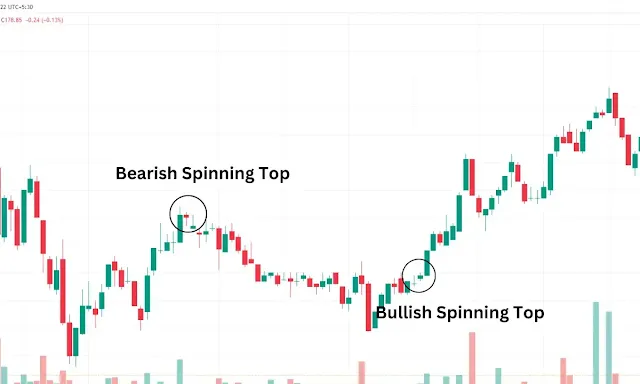
Spinning Tops: With their slender bodies and extended shadows, these patterns reflect a market in contemplation, often predicting the persistence of the prevailing trend.
Doji: The Doji is the market’s moment of equilibrium, where open and close prices align, signaling a balance of forces and a potential shift in the market’s direction.
While these patterns offer a glimpse into the market’s soul, they are but one piece of the puzzle. Wise traders weave them into a broader tapestry of analysis, using additional indicators to confirm trends and refine strategies. Remember, these patterns are not crystal balls but tools that, when used judiciously, can illuminate the path to trading success. 🌠
Advanced Candlestick Patterns
In the intricate dance of the markets, advanced candlestick patterns are sophisticated moves that reveal deeper insights into the market’s psyche and foreshadow significant price shifts. Here’s a distilled essence of these complex formations:
Complex Patterns and Their Insights:
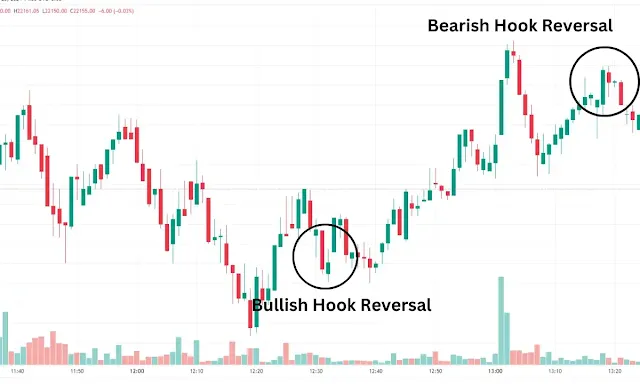
Island Reversal: Picture an island of prices, isolated by gaps on either side, signaling a potent reversal in the market’s current narrative.Hook Reversal: This pattern emerges as a subtle hint of change, with prices crafting a higher low and a lower high, whispering the possibility of a new direction.
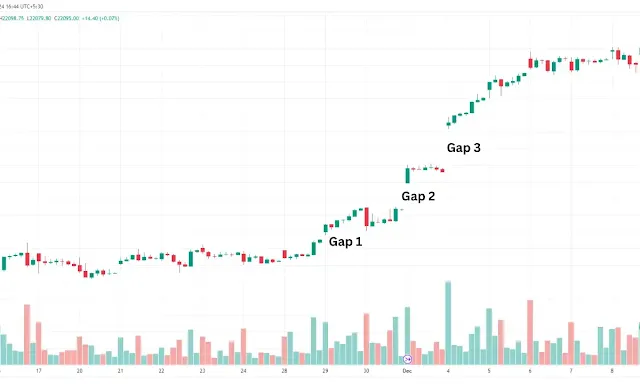
Three Gaps: Envision a trio of price leaps, each stepping further in the same direction, a testament to the market’s unyielding momentum.
Kicker Patterns: These are the market’s bold declarations, marked by a sudden volte-face in price, underscored by a gap, heralding some of the most decisive reversals.
Synergizing Patterns for Enhanced Foresight:
Savvy traders often orchestrate a symphony of analytical tools to amplify the foresight offered by candlestick patterns. Consider:
Moving Averages: These serve as the rhythm, confirming the trends suggested by the candlesticks.Oscillators: They act as the pulse, detecting the overextended highs and lows that resonate with reversal patterns.
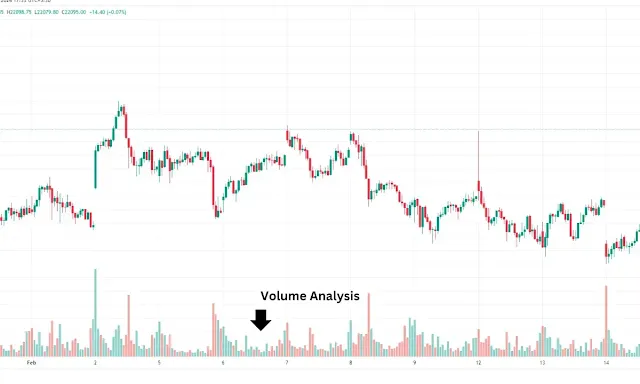
Volume Analysis: This is the crescendo, validating the conviction behind the patterns, with robust volume signaling strong market agreement.
By harmonizing these instruments, traders can compose a more nuanced understanding of the market’s movements, leading to more informed decisions. While no single pattern or tool can promise certainty, their collective melody can significantly refine market analysis. Candlestick patterns, with their rich heritage and modern relevance, continue to be integral to traders’ strategies across the globe, including in the vibrant financial theaters of the USA. 🌐📊
Candlestick Patterns in Different Time Frames
Candlestick patterns are the market’s Morse code, signaling the sentiments and trends that guide traders across time frames and strategies. Here’s how these patterns translate into actionable intelligence:
Intraday Trading: For the day trader, each candlestick is a note in the symphony of the markets, with patterns like the Doji, Hammer, and Shooting Star acting as key chords for potential trades. These traders read the patterns as signs to enter or exit, often harmonizing them with the rhythm of volume or the trend lines of moving averages for a fuller picture. The goal is to decode the day’s narrative, discerning whether it speaks of a reversal or a continuation of the market’s tale.
Swing Trading: Swing traders waltz through the market’s fluctuations, holding positions as they glide from days to weeks. They look to patterns such as the Engulfing Pattern, Morning Star, and Evening Star as signals to change partners, from bear to bull or vice versa. Oscillators join this dance, helping to confirm when the music of the market sentiment is about to change tempo.
Long-Term Investment Strategies: For the investor with an eye on the horizon, candlestick patterns are like lighthouses, illuminating long-term trends and potential shifts in the market’s current. While less concerned with the daily waves, patterns such as the Bullish Engulfing or Bearish Harami can signal a change in the tide, guiding decisions over weeks or months. These signals are often weighed alongside the gravity of fundamental analysis, aligning with the investor’s overarching goals.
In every market melody, candlestick patterns play a vital role, but they are not soloists. They perform best as part of an ensemble, alongside other indicators and market conditions, to inform a well-composed trading strategy. While they offer valuable insights, they are but one instrument in the orchestra of market analysis. 🎼📊
Technical Analysis with Candlestick Patterns
Candlestick patterns serve as the market’s compass, guiding traders through the labyrinth of price action. When fused with other technical indicators, they form a powerful alliance that can significantly bolster the credibility of trading signals.
Harmonizing with Technical Indicators: Candlestick formations, when orchestrated with tools like moving averages, can validate the direction of market trends. Oscillators, such as the Relative Strength Index (RSI), act as the market’s pulse, indicating when conditions are ripe for a reversal. This confluence of signals crafts a more resilient analysis, empowering traders with clarity and confidence in their decisions.
Volume: The Market’s Resonance: Volume is the resonance that confirms the market’s chorus. A candlestick pattern, when accompanied by a crescendo of volume, strikes a chord of reliability. For instance, a bullish engulfing pattern, backed by a surge in volume, resonates with strong buying pressure, hinting at an upward trajectory. Conversely, a bearish pattern, underscored by high volume, echoes with selling pressure. Volume candlesticks merge the melody of price action with volume, offering a symphony of market dynamics.
Support and Resistance: The Market’s Rhythm: Support and resistance levels are the rhythm to which the market moves, marking the beats where trends often pause or change their tune. Candlestick patterns that emerge near these levels strike a significant note. A reversal pattern at resistance may signal a change in the market’s rhythm, while a continuation pattern at support suggests the current melody may play on. Traders leverage these levels to choreograph their entries and exits, as well as to compose stop-loss orders to harmonize risk.
Integrating candlestick patterns with a suite of analytical tools allows traders to conduct a multi-dimensional market symphony, not just in price movements but in the psychology and activity that underpin them. It’s essential to remember that while these methods can illuminate insights, they should be part of a comprehensive trading opus that includes risk management and is attuned to the current market conditions.
Case Studies: Candlestick Patterns in Action
Here are some narratives that bring to life the practical magic of these patterns:
Real-World Pattern Recognition: In the digital age, the ancient wisdom of candlestick patterns has been distilled through the lens of machine learning. Studies have shown that convolutional neural networks can identify these patterns with remarkable precision, highlighting their enduring relevance in a world where algorithms often hold sway over markets.
Tales of Triumph: The trading world is replete with tales of triumph where candlestick patterns have played the starring role. The Inverted Hammer, for example, stands out with its high success rate, signaling trend reversals that have led many traders to the promised land of profitability.
Wisdom Gained: The journey with candlestick patterns teaches a vital lesson—the power of context. These patterns, while potent, unveil their true potential when they join forces with other technical indicators and fundamental analysis. It’s the confluence of these elements that traders have come to rely on for a more nuanced market understanding.
These case studies are not just stories; they are the collective experience of the financial community, underscoring the value of candlestick patterns in navigating the tides of the markets. They are a part of the trader’s arsenal, to be wielded wisely within a broader strategy of market engagement.
What is a candlestick pattern?
A candlestick pattern is a recognizable configuration of one or more candlesticks on a chart that traders use to predict future price movements based on past patterns. They are a key component of technical analysis.
Which candlestick pattern is considered bearish?
The Bearish Engulfing pattern is one of the most well-known bearish patterns. It occurs when a smaller bullish candle is followed by a larger bearish candle that completely engulfs the body of the previous candle, indicating a potential reversal from an uptrend to a downtrend.
What is the 15-minute candlestick strategy?
The 15-minute candlestick strategy involves analyzing 15-minute candlestick charts to make short-term trading decisions. Traders look for specific patterns that signal entry or exit points within smaller time frames.
Which time frame is best for trading with candlestick patterns?
The best time frame for trading with candlestick patterns depends on the trader’s strategy and goals. Day traders may prefer shorter time frames like 1-minute to 15-minute charts, while swing traders may look at 1-hour to 4-hour charts. Long-term investors might focus on daily or weekly charts.
How can I improve my skills in recognizing candlestick patterns? Practice is key to improving skills in recognizing candlestick patterns. Many traders use historical charts to identify patterns and backtest their potential trading strategies. Additionally, educational resources and simulation trading can help enhance pattern recognition skills.
Are candlestick patterns reliable?
Candlestick patterns can be reliable indicators of future price movements when used in conjunction with other forms of analysis, such as trend lines, volume, and other technical indicators. However, no single method is foolproof, and traders should use candlestick patterns as part of a comprehensive trading strategy.
Can candlestick patterns be used for all types of financial markets? Yes, candlestick patterns are versatile and can be applied to various financial markets, including stocks, forex, commodities, and cryptocurrencies. The principles of candlestick analysis are universal, although the context may vary across different markets and assets.
Key Takeaways
Candlestick patterns are a fundamental aspect of technical analysis, offering insights into market sentiment and potential price movements. Here are some crucial points to remember:
- Price Action: Candlestick patterns help traders understand the underlying market dynamics by visualizing the price action.
- Trend Reversal and Continuation: They can signal both reversals and continuations in market trends, aiding in decision-making.
- Confirmation: Patterns should be used in conjunction with other technical indicators for confirmation to increase reliability.
- Volume: The accompanying volume can strengthen the validity of the patterns.
- Context Matters: The significance of a pattern greatly depends on the market context and preceding price movements.
How to Continue Learning and Practicing: To further your understanding and proficiency in candlestick patterns:
- Educational Resources: Utilize books, online courses, and webinars focused on technical analysis and candlestick patterns.
- Practice: Apply your knowledge by analyzing historical charts and identifying patterns.
- Simulation Trading: Use demo accounts to practice trading based on candlestick signals without financial risk.
- Join Communities: Engage with trading communities to discuss and learn from others’ experiences.
- Stay Updated: Follow market updates and analyses to see how candlestick patterns play out in real-time market conditions.
Continued learning and practice are essential for mastering candlestick patterns and effectively incorporating them into your trading strategy. Remember, no single tool or pattern guarantees success; they are part of a broader analytical framework that includes market knowledge, experience, and risk management.
Bottom Lines
Candlestick charting, a time-honored technique birthed in the rice markets of ancient Japan, has gracefully weathered the passage of time. Today, it stands at the cusp of a new era, seamlessly blending with the digital revolution. Advanced charting software and automated systems have embraced candlestick patterns, enhancing their accessibility and functionality. These patterns continue to serve as a dynamic visual lexicon for interpreting the market’s pulse, proving their timeless relevance in the ever-evolving world of trade.
As technology reshapes the trading landscape, the role of candlestick patterns is also being redefined. They now dance in tandem with quantitative analysis and algorithmic strategies, enriching their traditional utility. This fusion has unlocked more intricate and subtle readings of market trends, cementing candlestick patterns as an indispensable tool for traders worldwide.
In the grand tapestry of trading, candlestick patterns are but one thread—vital, yet part of a larger weave. The essence of trading success lies not in the quest for prescience but in the art of adaptation. Continuous learning, emotional fortitude, and prudent risk management are the pillars that uphold this journey. “Trading is less about foretelling the future and more about responding to the now.” Let each trade be a stepping stone to wisdom, and my patience and discipline be your steadfast companions. With knowledge as your compass and experience as you sail, navigate the markets with a vision that reaches beyond the immediate horizon.


