Edited & Reviewed by: Taranjit Singh
Technical analysis thrives on deciphering the language of price charts. Candlestick patterns, like a financial Rosetta Stone, translate price movements into actionable insights. These patterns, formed by the interplay of opening, high, low, and closing prices, offer valuable clues about future trends.
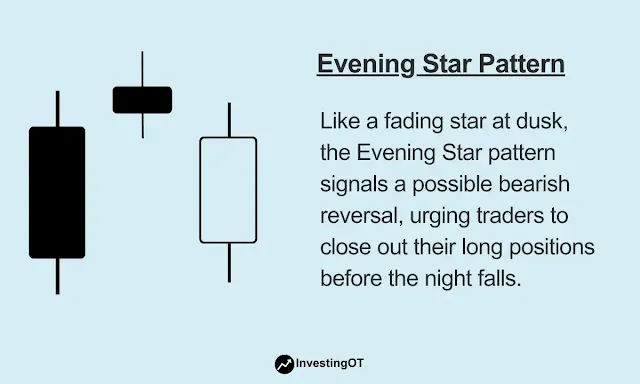
The Evening Star is one of the most significant bearish reversal signals that can be observed among various patterns. Its presence can be likened to a cautious whisper on the charts, hinting at a potential shift from uptrends to downtrends. Let's embark on a journey to understand how to identify and interpret this critical indicator.
Key Takeaways
- Evening Star: 3-candle pattern signaling a possible downtrend.
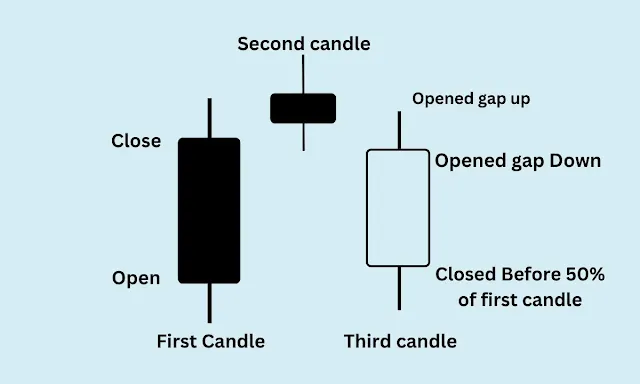
- Look for a large bullish candle, a small Doji/candle, and then a large bearish candle closing significantly lower.
- Confirmation (e.g., high volume) strengthens the signal.
- No indicator is foolproof; use stop-loss orders for risk management.
- Combine with other technical analysis tools for a well-rounded strategy.
Deciphering the Evening Star
Recognizing the Evening Star in Action
The Power of Confirmation
Limitations and False Signals
Trading Strategies with the Evening Star
Evening Star vs. Morning Star
Conclusion
Deciphering the Evening Star
Imagine a story playing out on your stock chart. The Evening Star unfolds in three distinct acts, each candle whispering a crucial piece of information.
Act I: The Bullish Charge (Large Bullish Candle)
The drama opens with a strong bullish candle, a testament to the ongoing uptrend. Prices surge, with the closing price settling significantly higher than the opening price. This powerful move reflects continued buying pressure and investor confidence.
Act II: A Moment of Doubt (Small-Bodied Candle or Doji)
The second act introduces a sense of hesitation. A small-bodied candle, or a Doji (a candle with a very short body), emerges. This formation signals indecision – buyers and sellers are in a tug-of-war, neither gaining the upper hand. The price movement is minimal, with the opening and closing prices nearly equal in the case of a Doji. This act serves as a potential turning point, hinting that the bullish momentum might be waning.
Act III: The Bearish Descent (Bearish Candle)
The final act unveils the true message of the Evening Star. A bearish candle emerges, decisively closing much lower than the opening price of the previous (small-bodied) candle. This significant decline suggests that sellers have overwhelmed buyers, potentially signaling a reversal of the uptrend.
Recognizing the Evening Star in Action
The Evening Star isn't just a theoretical concept. Let's put our newfound knowledge to the test by examining real-world examples. Historical charts can reveal instances where the Evening Star preceded significant price downturns, serving as a valuable warning sign.
Case Study: Unveiling a Reversal
Imagine a stock that's been on a steady climb. We see a large green (bullish) candle, signifying strong buying pressure (refer to the "Deciphering the Evening Star" section for a candle reference). This is Act I of our drama. Act II unfolds with a small Doji, hinting at indecision. Finally, Act III arrives with a large red candle closing well below the Doji's open. This dramatic decline suggests a potential reversal, and traders who identified the Evening Star might choose to exit their long positions or even initiate short positions in anticipation of a price drop.
Sharpen Your Skills: Key Features Table
To solidify your Evening Star recognition skills, let's refer to a table summarizing its key characteristics:
Training your eye to spot the Evening Star formation and examining historical charts can help anticipate trend reversals in trading.
The Power of Confirmation
While the Evening Star paints a compelling picture of a potential downtrend, it's not infallible. Just like whispers can sometimes be misinterpreted, so too can candlestick patterns. To bolster the Evening Star's message, traders often seek confirmation signals.
Imagine the Evening Star appears, but the trading volume on the bearish candle (Act III) is low. This muted response from investors might cast some doubt on the strength of the reversal. Conversely, a surge in trading volume alongside the bearish candle can be a powerful confirmation, suggesting a more forceful shift in sentiment and potentially a steeper decline.
Confirmation signals, like increased volume on the downside, can add weight to the Evening Star's bearish prediction. Remember, the more evidence that aligns with the pattern, the stronger the case for a potential trend reversal.
Limitations and False Signals
The market, like any story, can take unexpected turns. Just as whispers can be misleading, the Evening Star isn't a guaranteed predictor of downtrends. Here's why:
- False Breakouts: Sometimes, the second candle (Doji or small-bodied) might show a minor decline, but the market quickly recovers. This "shallow retracement" can create a false Evening Star, leading to unnecessary trades.
- Market Noise: Erratic price movements, especially in volatile markets, can mimic the Evening Star pattern. This "market noise" can be deceiving for traders.
Remember, no single indicator is perfect. Even when the Evening Star appears, a prudent trader should:
- Employ Risk Management: Always have stop-loss orders in place to limit potential losses if the price movement goes against your prediction.
- Seek Confirmation: Look for additional signs supporting the downtrend, such as increased trading volume on the bearish candlestick or a break below key support levels.
By acknowledging the limitations of the Evening Star and implementing sound risk management strategies, traders can navigate the market's whispers with greater awareness and confidence.
Trading Strategies with the Evening Star
The Evening Star whispers a cautionary tale, but how can you translate this into actionable trading strategies? Let's explore entry and exit points, along with the power of combining the Evening Star with other indicators.
Entry Points: Catching the Downtrend
Once you spot a confirmed Evening Star (remember, confirmation is key!), here are some strategies for entering short positions:
- Break Below the Low: A conservative approach is to wait for the price to decisively break below the low of the bearish confirmation candle (Act III) before entering a short position. This provides a clear downside confirmation.
- Stop-loss placement: Always place a stop-loss order above the high of the bearish confirmation candle to limit potential losses if the price unexpectedly reverses.
Exit Strategies: Knowing When to Take Profits
Taking profits is just as important as entering a trade. Here are some exit strategies to consider:
- Trailing Stop-Loss Orders: A trailing stop-loss automatically adjusts as the price moves in your favor, locking in profits while limiting downside risk.
- Support Levels: Identify potential support levels below the Evening Star formation. These areas might act as price floors, prompting you to exit your short position and take profits before a potential bounce.
Combining Forces: Evening Star and its Allies
The Evening Star is a valuable tool, but it doesn't operate in isolation. Here's how to combine it with other technical indicators for a more robust trading strategy:
- Moving Averages: A downward-sloping moving average can add weight to the Evening Star's bearish prediction.
- Relative Strength Index (RSI): An RSI reading above 70 suggests overbought conditions, potentially aligning with the Evening Star's bearish reversal signal.
Remember, the Evening Star is a piece of the puzzle, not the entire picture. By combining it with other indicators and employing sound risk management, you can make more informed trading decisions as you navigate the ever-evolving market landscape.
Tip: While the Evening Star whispers a potential downtrend, confirmation through high volume on the bearish candle and trailing stop-loss orders can solidify your short position for better risk management.
Evening Star vs. Morning Star
Imagine the Evening Star and Morning Star as opposite sides of the coin, each predicting a change in the stock's direction. Here's a quick breakdown:
Evening Star (Goodnight to Uptrends):
- Looks like: Three candles. First - big and black (downtrend). Second - small or Doji (indecision). Third - big and green (but closes much lower than the second), confirming a possible downtrend continuation.
Morning Star (Good Morning to Downtrends):
- Looks like: Three candles (same as Evening Star). First - big and black (downtrend). Second - small or Doji (indecision). Third - big and green (but closes much higher than the second), confirming a possible uptrend reversal.
Key Difference: The color and closing position of the third candle.
- Evening Star: Green candle closes lower, whispers "downtrend."
- Morning Star: Green candle closes higher, whispers "uptrend coming!"
How reliable is the Evening Star pattern?
No single indicator is perfect, and the Evening Star is no exception. While it can be a strong bearish reversal signal, it's not foolproof. Confirmation from other indicators and sound risk management are crucial.
Can the Evening Star be used in all markets?
The Evening Star can be applied to various markets (stocks, forex, etc.) but might function slightly differently depending on the market's volatility.
What are alternative bearish reversal patterns?
Besides the Evening Star, other technical indicators signal potential downtrends. These include:
- Head and Shoulders: A pattern resembling a head with two lower shoulders, suggesting a trend reversal.
- Double Top: Two swing highs at roughly the same price level, followed by a trough, indicating a possible trend reversal.
- Engulfing Bearish: A large bearish candle that completely engulfs the previous bullish candle, showcasing strong selling pressure.
Conclusion
The Evening Star emerges as a valuable companion for technical analysts, whispering cautionary tales of potential downtrends. By recognizing its three-act structure (large bullish candle, small Doji or small-bodied candle, and decisive bearish candle), you gain a powerful tool to identify possible trend reversals.
Remember, confirmation signals such as higher trading volume on the bearish candle can enhance the Evening Star pattern's significance. However, no indicator is infallible, and employing sound risk management strategies is paramount.
The Evening Star, when used effectively alongside other technical analysis tools, empowers you to navigate the ever-changing market landscape with greater awareness and potentially make informed trading decisions. So, the next time you see this formation on your charts, heed the Evening Star's subtle whispers – they might just hold the key to unlocking your next trading opportunity.

