Edited & Reviewed by: Taranjit Singh
Understanding Candlestick Patterns
Before diving into the Piercing Line Candlestick pattern, it's essential to understand the basics of candlestick patterns. Candlesticks are graphical representations of price movements in financial markets, with each candlestick showing the open, high, low, and close prices for a specific time frame. Candlestick patterns provide valuable insights into market sentiment and can help traders make informed decisions.
The Structure of the Piercing Line Candlestick
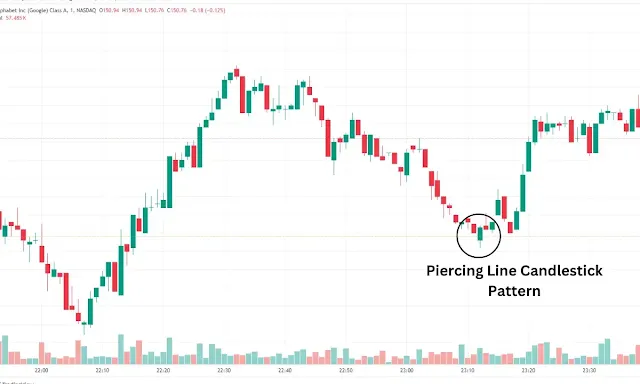
The Piercing Line Candlestick pattern consists of two candlesticks:- The first candlestick is a long bearish candle, indicating that the market is in a downtrend.
- The second candlestick is a long bullish candle, which opens lower than the closing price of the first candlestick but closes more than halfway up the body of the first candlestick.
The second candlestick's ability to "pierce" through the first candlestick's body is where the pattern gets its name.
The Significance of the Piercing Line Candlestick
The Piercing Line Candlestick pattern is significant because it indicates a potential shift in market sentiment. The long bearish candle in the pattern shows that sellers are in control, but the long bullish candle that follows suggests that buyers have stepped in and are pushing the price higher. This shift in momentum can signal a trend reversal, making the Piercing Line Candlestick a valuable tool for traders looking to enter long positions.
Tip: Maximize your Piercing Line Candlestick strategy by combining it with other technical indicators. Always confirm signals to minimize false alarms and maximize profits.
Identifying the Piercing Line Candlestick
To identify the Piercing Line Candlestick pattern, look for the following characteristics:- A clear downtrend in the market.
- A long bearish candle followed by a long bullish candle.
- The bullish candle opens below the closing price of the bearish candle but closes more than halfway up its body.
Confirming the Piercing Line Candlestick
While the Piercing Line Candlestick pattern can be a strong indicator of a trend reversal, it's essential to confirm the pattern before making trading decisions. Here are some ways to confirm the pattern:- Look for increased volume during the formation of the bullish candle, which can indicate stronger buying pressure.
- Check for additional bullish candlesticks following the Piercing Line Candlestick, which can confirm the trend reversal.
- Use other technical indicators, such as moving averages or oscillators, to support the trend reversal signal.
Trading the Piercing Line Candlestick
To trade the Piercing Line Candlestick pattern, consider the following steps:- Identify the pattern in a downtrend.
- Confirm the pattern using the methods discussed above.
- Enter a long position after the completion of the bullish candle.
- Set a stop-loss order below the low of the bullish candle.
- Set a profit target based on previous resistance levels or other technical indicators.
Examples of the Piercing Line Candlestick
To better understand the Piercing Line Candlestick pattern, let's look at an example:Advantages and Limitations of the Piercing Line Candlestick
Advantages:- The Piercing Line Candlestick pattern can provide early signals of a trend reversal, allowing traders to enter long positions at potentially favorable prices.
- The pattern is relatively easy to identify and can be used in conjunction with other technical indicators to confirm trend reversals.
Limitations:
- The Piercing Line Candlestick pattern is not always accurate and can result in false signals.
- The pattern requires confirmation, which may not always be immediately available.
Combining the Piercing Line Candlestick with Other Technical Indicators
To increase the accuracy of the Piercing Line Candlestick pattern, consider combining it with other technical indicators, such as:- Moving Averages: Use moving averages to confirm the trend. For example, if the Piercing Line Candlestick pattern forms after a downtrend, look for a bullish crossover of the short-term moving average above the long-term moving average.
- Relative Strength Index (RSI): Use the RSI to confirm the strength of the trend reversal. For example, if the RSI is above 30, it indicates that the security is oversold, and a trend reversal may be imminent.
- MACD: Use the Moving Average Convergence Divergence (MACD) to confirm the momentum of the trend reversal. For example, if the MACD line crosses above the signal line, it indicates that the momentum is shifting from bearish to bullish.
Limitations of the Piercing Line Candlestick
While the Piercing Line Candlestick pattern is a powerful tool for identifying trend reversals, it has some limitations. For example:- False Signals: The pattern may generate false signals, leading to incorrect trading decisions.
- Market Conditions: The pattern may not work well in all market conditions. For example, it may not be effective in a choppy or sideways market.
- Time Frame: The pattern may not work well in all time frames. For example, it may be more effective in daily or weekly charts than in intraday charts.

